File:Syncell whitespace.png
Jump to navigation
Jump to search

Size of this preview: 800 × 522 pixels. Other resolution: 1,966 × 1,282 pixels.
Original file (1,966 × 1,282 pixels, file size: 890 KB, MIME type: image/png)
Summary
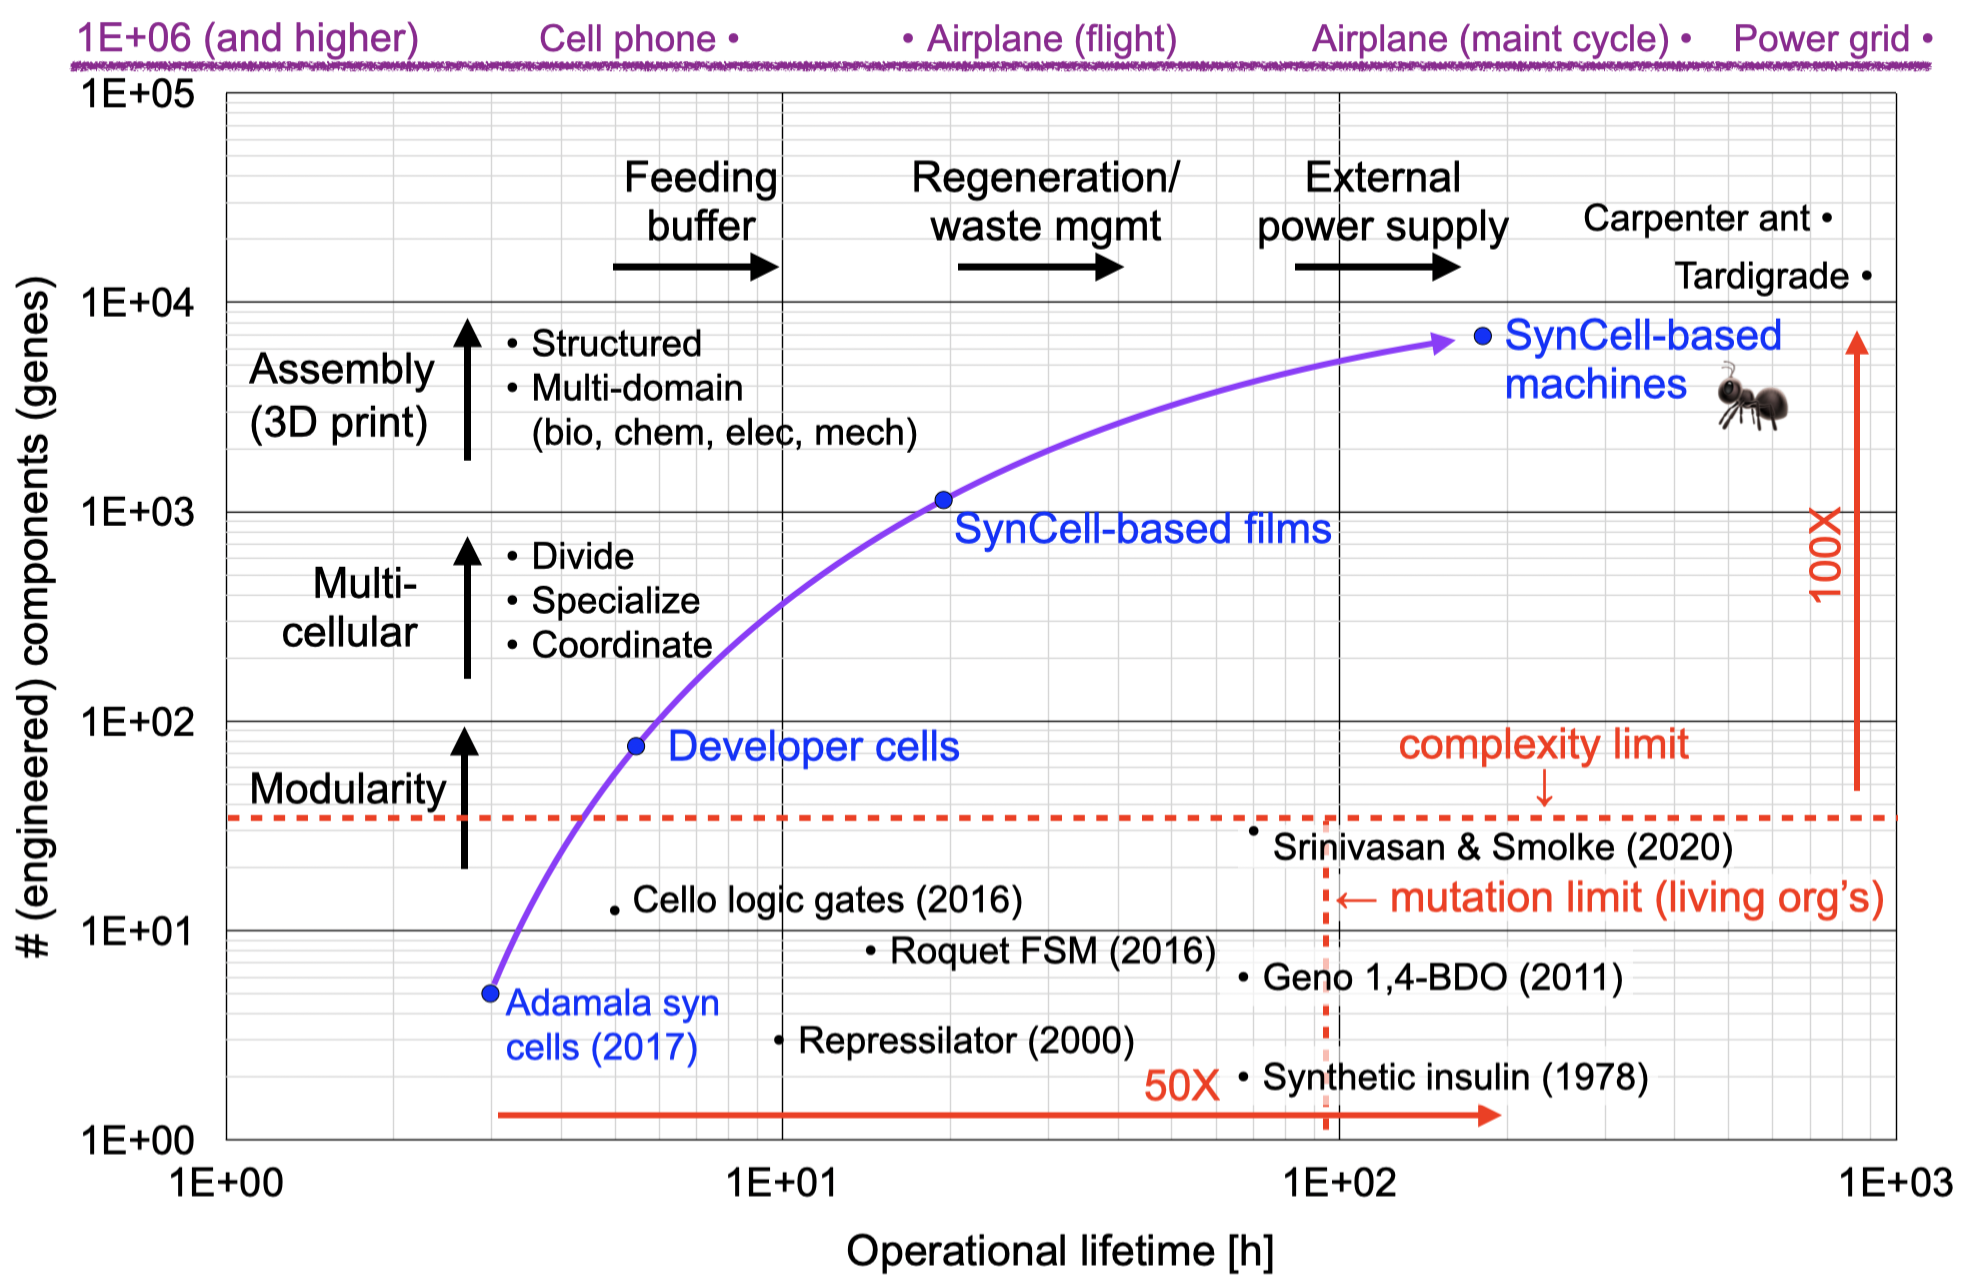
DARPA "white space" chart. This chart shows a conceptual trajectory for using synthetic cells to engineering biology at scale. The vertical axis measures the complexity of the system by the number of engineered functional elements (nominally a gene assembly, such as a repressor). The horizontal axis measures the operational lifetime of the systems.
Individual data points:
- Adamala Syn Cell (2017): 6-8 genes, ran for 3-6 hours
- Represillator (2000): 3 genes, ran for ~10 hours before oscillations died out
- Roquet FSM (2016): 6-input FSM used 8 genes. Ran over 6 days [need to confirm]
- Cello logic gates (2016): 11 genes in half-adder, ran for 4-8 hours
- Synthetic insulin - 2 peptides in E. coli. Batches run for 24-72 hours
- Geno 1,4-BDO (2011): 6 genes in E. coli. Batches run for 24-72 hours
- Srinivasan and Smolke (2020): 26 genes (+ 8 deletions) in yeast for 72 hours
- Tardigrade: lives ~2 months, 11-14K genes
- Carpenter ant: 17K genes, lives for a year, 2-6 weeks w/out food
Licensing
File history
Click on a date/time to view the file as it appeared at that time.
| Date/Time | Thumbnail | Dimensions | User | Comment | |
|---|---|---|---|---|---|
| current | 03:50, 30 August 2025 | | 1,966 × 1,282 (890 KB) | Murray (talk | contribs) | Changed artificial insulin to synthetic insulin |
| 03:29, 30 August 2025 |  | 1,966 × 1,282 (1.4 MB) | Murray (talk | contribs) | Initial chart. |
You cannot overwrite this file.
File usage
The following page uses this file: